
I’ve been poking around in the USAPL dataset my last article was based on, and I came across something that’s worth a quick share.
I was interested in seeing whether your current level of strength is predictive of the rate you could expect to make gains in the short-to-medium term. To investigate, I picked out everyone who showed up in the database multiple times. Since the date of each competition was reported, I could calculate the rate of strength gain or loss per day between meets using this formula: (second total – first total)/(first total × days between meets) = rate of strength gains.
For example, if someone totalled 1200 on March 4th, and then totalled 1260 on May 13th of the same year, their rate of strength gains would be (1260 – 1200)/(1200 × 70) = 0.07% stronger per day.
The only people I removed from the dataset were very clear outliers (i.e. z-scores of ±8 or more) who pretty obviously either had a good meet and then got injured in their next meet (so they posted a total way below what they were capable of in the second meet, showing an unrealistic loss in strength), or vice versa (they posted a total way below what they were capable of in the first meet, showing an unrealistic gain in strength).
I used allometrically scaled strength instead of absolute strength to account for body size (i.e. you may expect that someone who weighs 150lbs would struggle to add to a 1500lb total, whereas someone who’s 300lbs would have no problem adding to a 1500lb total).
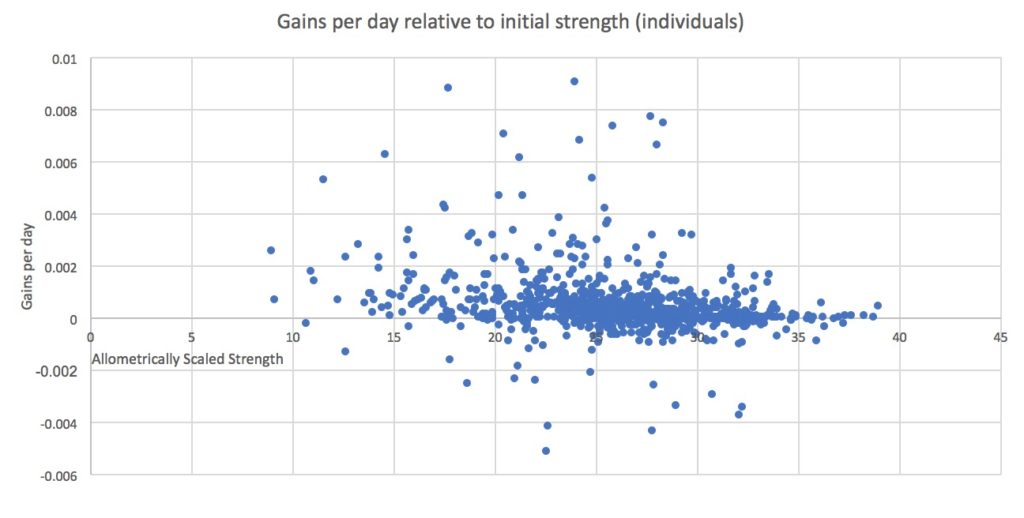
Here were the results for men:
And here were the results for women:
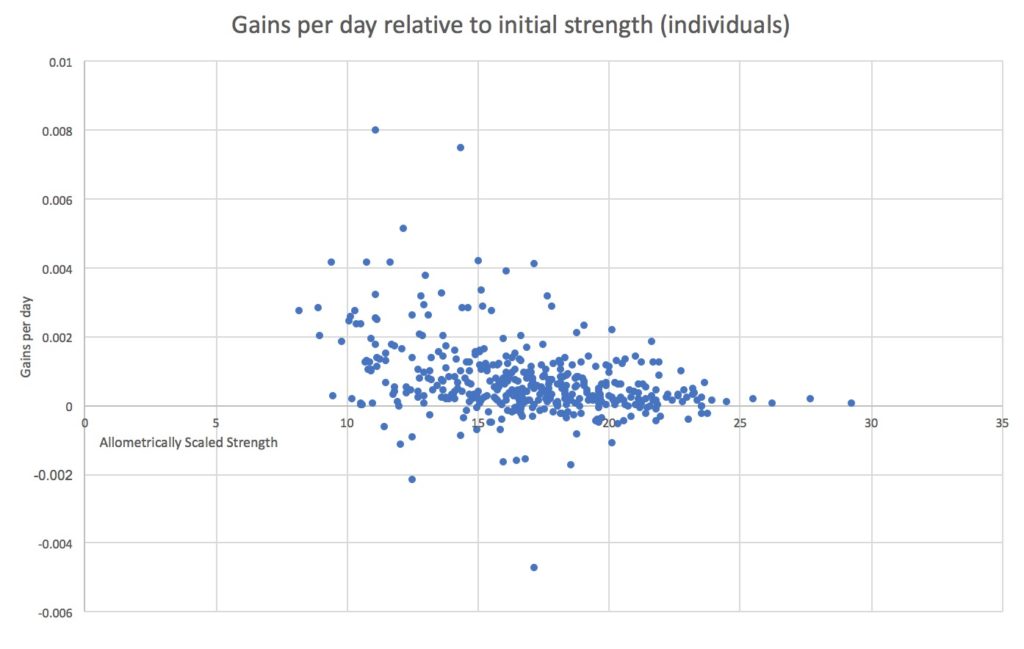
If you looked at these two graphs and thought to yourself, “hey, the relatively weaker people may have made slightly faster progress, but there’s really not much of a relationship at all here,” you’d be correct. The r2 value with a simple linear regression was only 0.06 for men, and 0.12 for women, meaning variation in strength only explained 6-12% of the variation in rate of progress. That’s counterintuitive because we assume that weaker people will predictably make faster gains than stronger people – while that relationship did show up, I’d wager that most people wouldn’t expect initial relative strength to be such a weak predictor
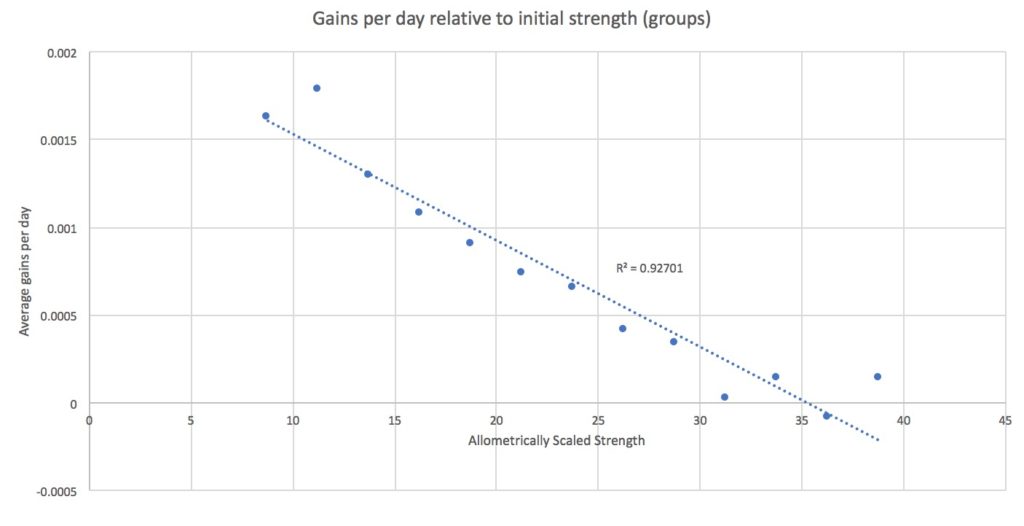
Now, however, let’s look at the data expressed another way. In the graphs below, I grouped people based on their initial relative strength levels.
Here’s how it looks for men:
And here are the women:
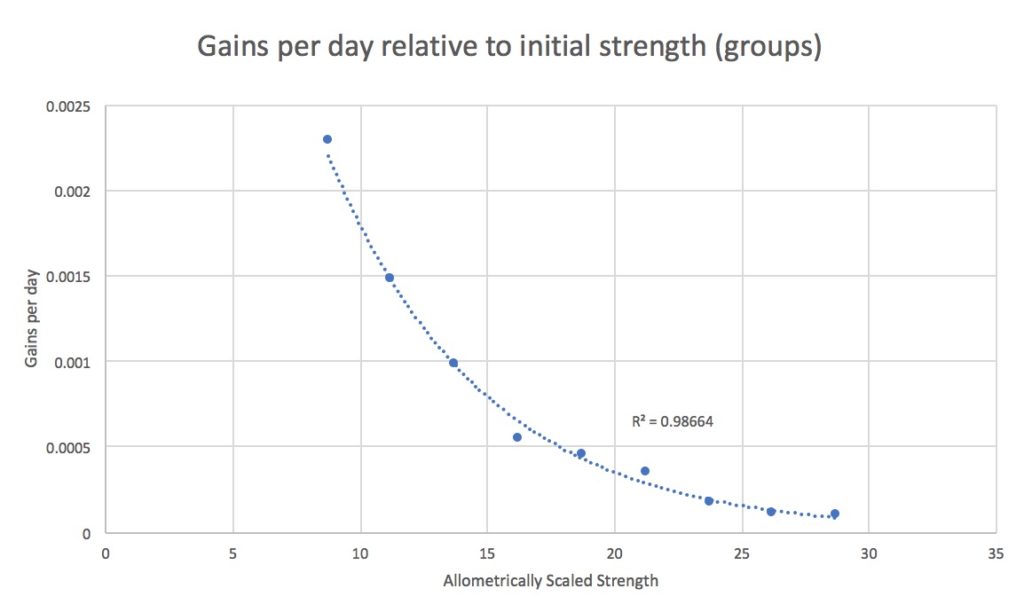
These graphs come from the exact same data, without any sort of underhanded manipulation. I decided how large to make each range of strength to group people together before analysis, and I didn’t tinker with those ranges or go back and fiddle with any data to get a better fit. On a group level, rate of progress declines almost perfectly linearly for men as relative strength increases. For the women, there’s an almost perfect exponential decrease in rate of strength gains as relative strength increases.
However, these very clear group trends mask the tremendous variability between individuals.
This is a challenge we need to deal with when approaching scientific data. Studies tend to report changes at the group level and differences between groups, but as you can see, there’s a lot of individual variation lurking beneath the surface.
Assuming that the characteristics of a group accurately describe all the individuals in that group is (depending on the circumstance) either a fallacy of division or an ecological fallacy. They’re easy traps to fall into, even among bright people. When you discuss the results of a study, I think it’s important to work the phrase “on average” into your discussion pretty liberally when describing group-level results. As a reader/listener, you should assume those “on average”s are peppered throughout the discussion, even when they’re not explicitly stated. That will help keep you from falling into this very pervasive and sneaky trap.
Now, don’t get me wrong: it’s not that there’s anything wrong with knowing/reporting group averages. They’re extremely valuable as a starting point. As a coach, knowing that relatively weaker people tend to progress faster than relatively stronger people is worthwhile when setting up a program with a set progression scheme, for example. You may want to start weaker people off with a faster progression scheme, and stronger people with a slower progression scheme. However, you need to be aware that the weaker person may need to progress slower, or the stronger person may be able to handle a faster progression scheme – they can be different from the group averages without being particularly abnormal. The same applies to essentially any training variable, from volume to intensity to frequency to exercise selection, etc. Group data are great for establishing a starting point, but individual experimentation is needed past that point.
If you’re interested in science and value thorough and honest data analysis, you’ll probably like the research review I’m launching with Eric Helms and Dr. Mike Zourdos. You can pick up the first copy for free here, or by clicking the image below.

Thanks again to /u/ferruix for curating the data over at OpenPowerlifting, and /u/TechnoAllah for hooking me up with the complete dataset. Also, thanks to Andrew Vigotsky for inspiring this article.