I constantly see the claim that an FFMI of 25 is the “natty limit” of muscularity, and that it’s impossible (or at least unbelievably unlikely) that you can get more muscular than that without the use of steroids.
To backtrack a bit for people who feel like they’re stepping into the middle of a conversation, the Fat-Free Mass Index (FFMI) is a measure of muscularity. You calculate it by dividing lean body mass (in kg) by height (in meters) squared.
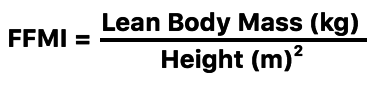
It’s essentially the same formula as Body Mass Index (BMI), but for lean body mass instead of total body mass. The higher your FFMI, the more jacked you are.
It’s been proposed by several prominent members of the online fitness community that no drug-free lifters can attain an FFMI above 25 – if someone has an FFMI over 25, you know for sure they’re on drugs. The less extreme view is that one or two rare outliers may be able to attain an FFMI over 25 without drugs, but doing so would be so incredibly unlikely, that you can still be 99% sure someone’s on the sauce if their FFMI exceeds 25.
In this article, I want to explain why that position is probably wrong or, at the very least, why there’s insufficient evidence to make such a statement.
This is a topic I’ve addressed before, but:
- It was in a rather dry methodology section in a previous article. It wouldn’t surprise me if most people simply skipped this discussion to get to the more exciting stuff.
- This is a claim I still see all the time (like, seriously at least once or twice a day), so I think it deserves its own article to debunk it once and for all.
The claim that an FFMI of 25 is the “natty limit” can be traced back to this study: “Fat-Free Mass in Users and Nonusers of Anabolic-Androgenic Steroids” by Kouri, 1995.
To pull a quote from the discussion of this article: “In an examination of 157 athletes, comprising 83 steroid users and 74 nonusers, we calculated normalized FFMI using height, weight, and body fat based on skinfold measurements. With this simple measurement, we found that athletes who had not used steroids all had values of <25.0, whereas a large proportion of steroid-using athletes easily exceeded this limit.”
That seems pretty cut and dry, right? As I’m sure you can surmise from the introduction, I think we need to dig a bit deeper. I’ll be pulling a lot of direct quotes from the study, but the full text is available for free (and it’s not overly technical), so I’d encourage you to read it for yourself.
What the Researchers Did
From the study:
“One hundred fifty-six men in a large controlled study of athletes recruited at gymnasiums in the Boston and Los Angeles areas, were administered physical examinations as part of a larger study (14). These physical examinations included determinations of height, body weight, and body fat, the latter computed from the sum of six skinfold measurements using an equation derived from the data of Jackson and Pollock.”
That doesn’t tell you all that much about the people included in the trial, so I tracked down the prior study that expanded upon the inclusion criteria:
“We advertised in four gymnasiums in the Boston, Mass, area and in three gymnasiums in the Santa Monica, Calif, area to recruit subjects. We offered $60 for a confidential interview to any male aged 16 years or older who had lifted weights for at least 2 years.”
This is our first red flag: If you’re designing to study to see what the limits of drug-free muscularity are, you’d want to make sure your subjects are actually at least near their own genetic ceilings. As it is, the only requirements were being at least 16 years old, and lifting weights for at least two years. I hope we can all agree that a) most gym-goers don’t train particularly effectively and b) most people aren’t closing in on their genetic limits after just 2 years of training.
Now, it’s likely that there were a few subjects who were actually pretty close to their muscular limits. 1 However, odds are very good that most of the participants were just typical gym-goers – not the population you want to study if you’re interested in the limits of drug-free muscularity. At the very least, there was an incentive for anyone to participate (getting paid $60), and no methods in place to specifically screen for people who were nearing their limits.
It’s not uncommon to re-analyze data that had been collected for a separate study. However, it’s important to make sure the data are equipped to answer the research question proposed in the new study. In this case, they aren’t.
The next few paragraphs discuss how some of the men didn’t have skinfold measurements and couldn’t be included in the analysis, and how an extra batch of subjects from a study in progress were added, leaving them with a pool of 157 subjects. “Of these, 74 (47%) had never used steroids (henceforth called ‘nonusers’) and 83 (53%) had used steroids (‘users’).”
This is our second red flag: If you’re designing a study to assess the limits of any human trait, you’d better make sure your sample size is larger than 74 individuals. Even if you have a sample of 74 exceptionally tall people, you’re probably not going to find any 8′ people (the world record is 8’11.1″). Even if you have a sample of 74 fast people, you’re probably not going to find anyone who runs a 9.8s 100m (the world record is 9.58s). Even if you have a sample of 74 exceptionally strong people, you’re probably not going to find any 600lb benchers (the world record is 738.5lbs). People who are 8′ tall, run a 9.8s 100m, and bench press 600lbs are freaks, but not particularly close to the highest level of human attainments in those domains.
In short, if you want to know how jacked someone can possibly get without drugs, you’re going to need more than 74 subjects, regardless of who those subjects are.
To the researchers’ credit, they acknowledge this. From the conclusion:
“Admittedly, one cannot definitively diagnose steroid use simply on the basis of the FFMI, much as one cannot make a definitive diagnosis of alcohol intoxication in a man who displayes ataxia and dysarithria upon getting out of his automobile. In the latter case, however, the individual may be required for forensic reasons to produce a breath or urine sample. Perhaps we could ultimately follow an analogous procedure in forensic situations with individuals displaying an abnormally elevated FFMI.”
The researchers knew that their data weren’t sufficient to assume anyone with an FFMI of 25+ was automatically on steroids. They proposed that FFMI should work as nothing more than an initial screen. i.e. if someone has a really high FFMI, that just means there may be sufficient reason to do a blood or urine test for steroids.
I think we can all agree that’s reasonable. There’s a higher chance that super jacked people are on steroids than less jacked people. However, labeling an FFMI of 25 as a hard limit for non-users was a subsequent invention of the internet. It’s not something proposed by this study, and it’s not something the researchers themselves would agree with.
Next, the researchers plotted the FFMIs of users and nonusers and discussed their data (lengthy quote incoming):
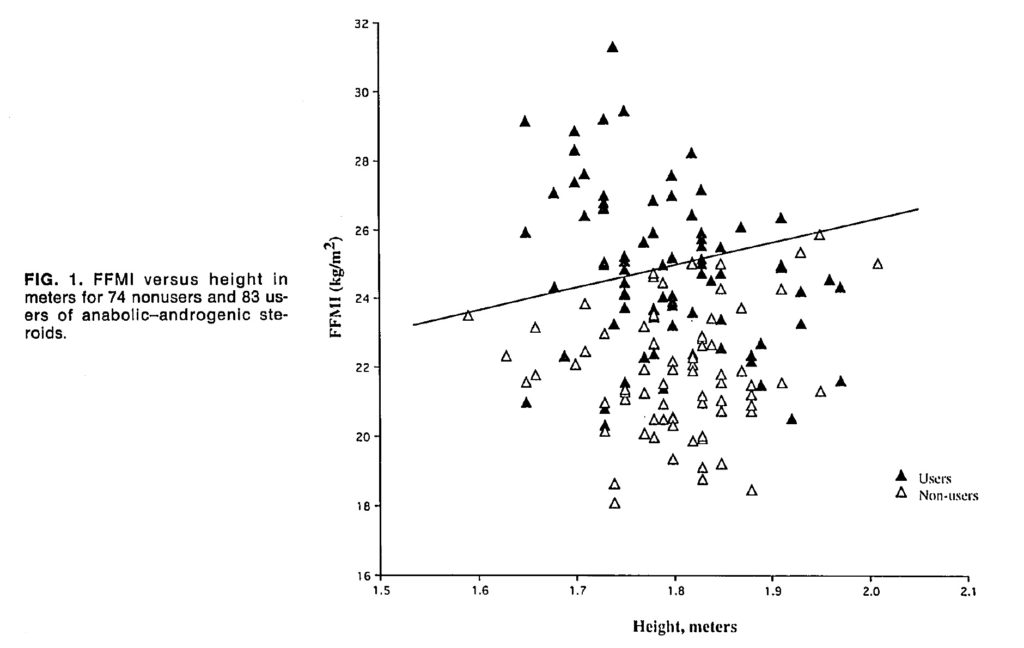
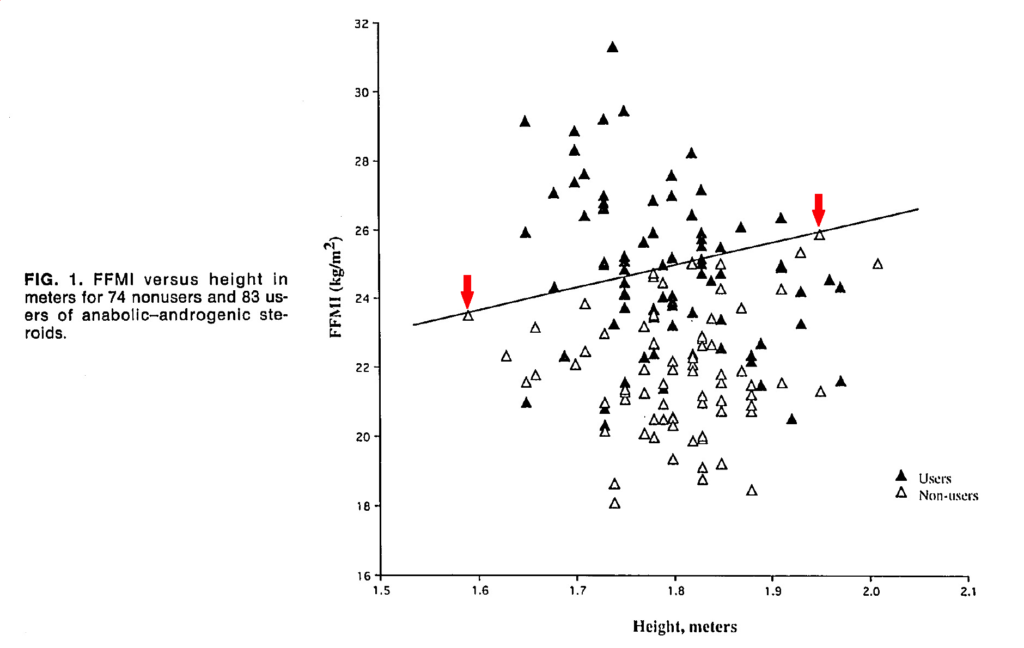
“Figure 1 shows a plot of FFMI versus height in meters for all of the subjects in the study. The nonusers extended up to a well-defined limit, shown as a diagonal line in the figure; many nonusers were just below this line, but non exceeded it. On the other hand, users extended well beyond the line with 37 (45%) of the users attaining levels of FFMI beyond the uppermost of the nonusers.
The ‘cuttoff’ line has a positive slow rather than a zero slope in the figure, perhaps because the factor of height-2 in the FFMI calculation does not fully account for the fact that human beings are three-dimensional rather than two-dimensional objects. In other words, the tallest athletes were not only taller, but also wider and thicker than the shorter athletes of apparently comparable muscularity; thus, the tallest athletes scored somewhat higher on the FFMI calculation. Our clinical impressions supported this speculation. During the preparation of this article, we called in the shortest nonuser (height 1.59m) and one of the tallest nonusers (height 1.93m) and remeasured both of them. The shortest athlete displayed an FFMI (without normalization) of 23.5, whereas the tall one scored 25.4. however, on visual inspection, the short athlete appeared more muscular than did the tall one.
To generate an approximate correction for this apparent effect of height, we calculated the slope of a regression line drawn through a plot of all the ‘elite’ nonuser athletes with FFMI scores of 22 or above. (We limited the regression calculation to this subgroup because we felt that the distribution of the elite group would more closely reflect the dictates of physiology and not be confounded by lack of achievement, as in the less muscular subjects.) This calculation yielded a slope of 6.1kg/m2. We then used this value to calculate a ‘normalized’ FFMI, in which the FFMI was normalized to that of a 1.8-m athlete (the mean height of the nonusers):
Normalized FFMI = FFMI + 6.1 x (1.8 – h)
where h is height in meters.
Using normalized FFMI, we obtained the plot shown in Fig. 2. Again, it can be seen that the nonusers ‘stop’ abruptly at a maximum value of 25.0, whereas many users extend well beyond this limit.”
First, let’s take a look at the data they’re referring to:
Next, let’s unpack these paragraphs:
1) The authors acknowledge that FFMI itself may not be a great way to assess muscularity in the first place. 2
Something like a version of the corpulence index (CI) applied to lean mass may work better. While BMI is mass divided by height squared, CI is mass divided by height cubed (to account for the fact that humans are three-dimensional). The FFMI formula is the same as the BMI formula, except that it only deals with lean mass instead of total mass; lean mass divided by height cubed (similar to the CI) may work better.
On the other hand, other work has shown that there’s actually a negative relationship between BMI and height, suggesting that you should instead raise height to a power smaller than 2 to accurately scale body mass to height. The same may apply to lean mass as well.
TL;DR: scaling is tricky, and it’s not even clear that FFMI is actually a valid, meaningful measure to compare human muscularity.
2) Going by raw FFMI values, there was actually at least one individual in the nonusers group who had an FFMI above 25.
One guy was 1.93m tall (6’3”) with an FFMI of 25.4, meaning he had about 94.6kg (208.5lbs) of lean mass. I shouldn’t need to tell you this, but that’s pretty damn big. For context, that means he’d step on a bodybuilding stage at 7% body fat at around 102kg (225lbs). The FFMI “cutoff” of 25 doesn’t arise until the researchers applied a “correction” to their data.
3) The correction they applied 3 was post-hoc and fairly arbitrary.
In the methods section of the paper, the authors state that their intention was simply to calculate FFMIs of the athletes using the typical FFMI formula (lean mass divided by height squared).4 They didn’t decide to make any adjustments until they’d already collected their data. That’s not necessarily a “bad” thing, but results you only get after doing some post-hoc fiddling with your data aren’t supposed to be heralded as the main finding of a study; they typically just get a brief mention in the discussion.
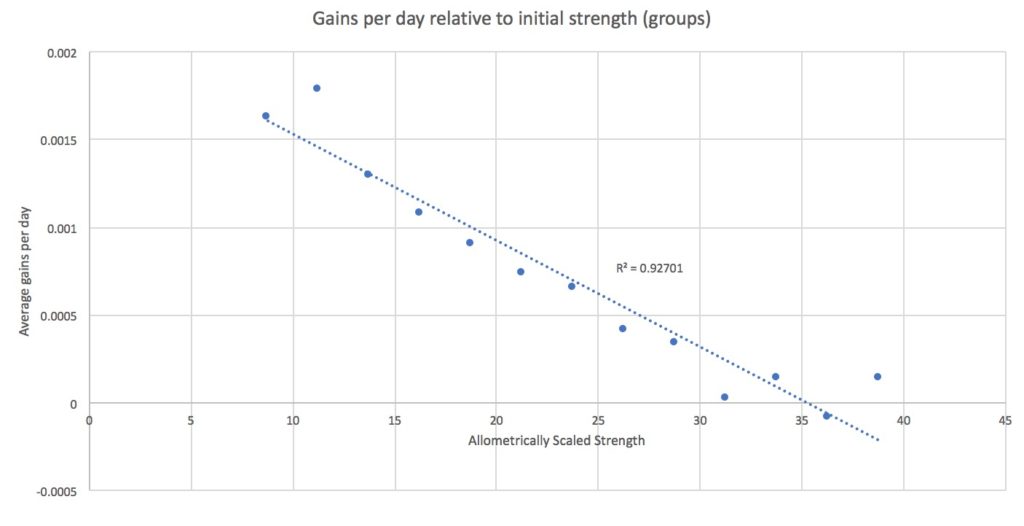
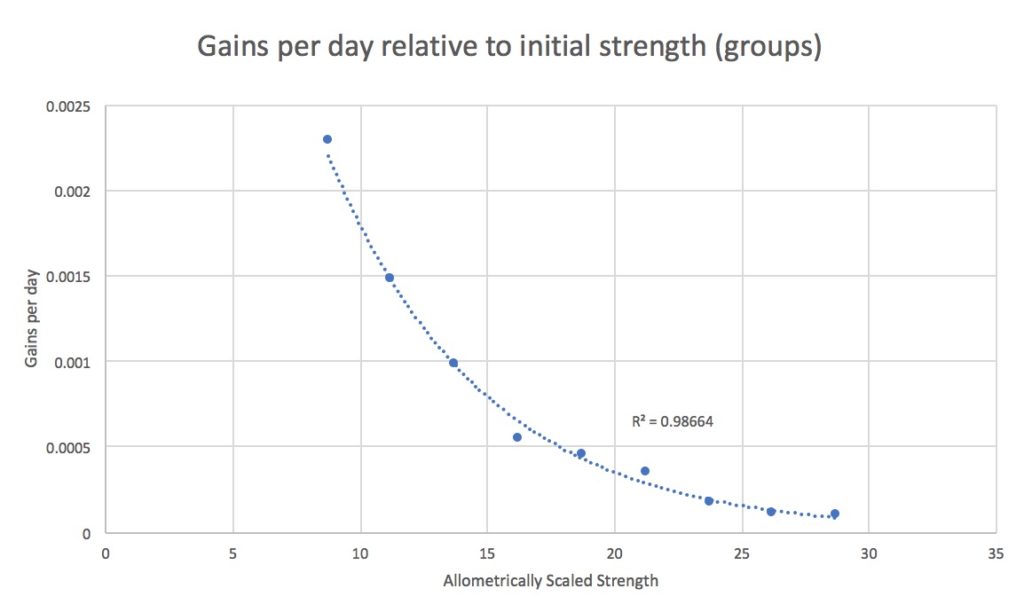
You can look at the scatterplot itself to see that correction they applied probably wasn’t necessary. If there was an overall positive trend between FFMI and height, a correction may be warranted. In this case, it’s pretty clear that the relationship between FFMI and height is either weak or nonexistent. The line drawn through the data isn’t a trendline; it’s just an arbitrary line on which the drug-free people with the 1st, 3rd, 6th, and 13th highest FFMIs in the study fell.
To calculate the correction (which they admit is an “approximate” correction), they picked a subgroup of the nonusers and looked at the relationship between height and FFMI. Importantly, they didn’t report a correlation coefficient to tell us the strength of the relationship; if it wasn’t a strong relationship in the first place, it would seem odd to use it to calculate the correction.
TL;DR: without a correction, there were one or two people in a random sample of 74 gym rats with an FFMI over 25. The authors’ justification for applying a correction is pretty flimsy, and the correction was a post-hoc addition in the first place.
4) The authors themselves don’t even think the correction “worked.”
This is pretty easy to miss if you’re not paying attention, but the authors state:
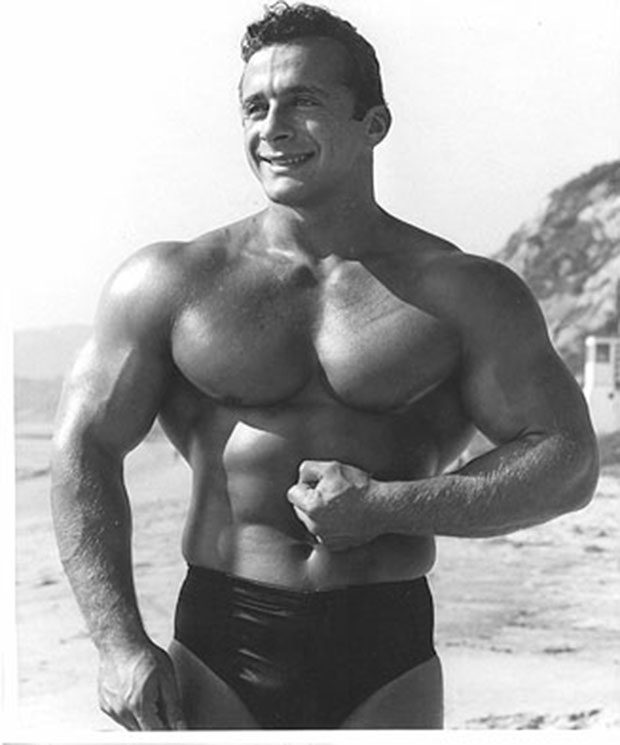
“During the preparation of this article, we called in the shortest nonuser (height 1.59m) and one of the tallest nonusers (height 1.93m) and remeasured both of them. The shortest athlete displayed an FFMI (without normalization) of 23.5, whereas the tall one scored 25.4. however, on visual inspection, the short athlete appeared more muscular than did the tall one.”
Here are those two individuals:
We know enough about them to calculate their “normalized” FFMIs. It’s 24.78 for the short guy, and 24.6 for the tall guy – virtually identical. The 0.18 point difference is effectively meaningless (around .5kg/1lb of lean mass).
The authors themselves say they thought the shorter guy seemed more muscular than the taller guy, but their formula says they’re equally jacked. However, if they applied a larger correction to reflect that, it would mean pushing the short guy over the “magic” FFMI threshold of 25.
Next, the study goes from “okay, this isn’t great, but if we overlook some flaws, we can still probably learn something,” to “holy crap, how the heck did this even get published”:
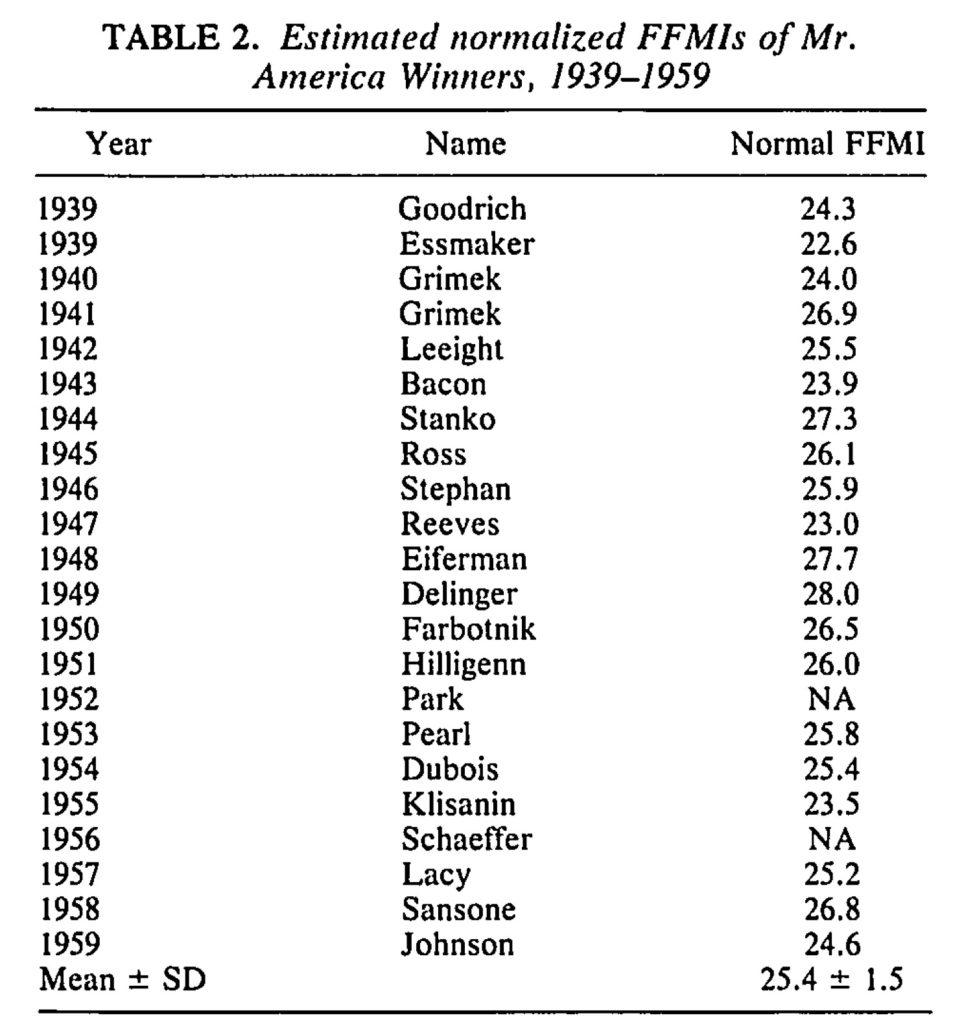
“To further test the limits of FFMI, we obtained the heights, weights, and ages, at the time of competition, of all Mr. America winners from 1939 to 1959. Because anabolic steroids were not available in gymnasiums during this era (Todd T, personal communication, July 1994), these athletes likely represented the maximum FFMI attainable without drugs. The second author (H.G.P.) estimated the body fat of each athlete from contemporaneous photographs in bodybuilding magazines of the era, averaging the estimates from several photographs of each athlete. [Dr. Pope based these estimates on having performed body fat measurements with calipers on >200 men in the course of previous studies, thus giving him substantial experience in estimating fat from a subject’s appearance.] The athlete’s face and written identifying information were obscured during this exercise to render all estimates blind. Adequate photographs could not be found for two Mr. America winners (Park, 1952; and Schaefer, 1956). The estimated normalized FFMIs for the other 20 athletes are shown in Table 2 and charted on the left-hand side of Fig. 3. It will be seen that the presteroid Mr. America winners displayed a mean (+/- SD) normalized FFMI of 25.4 +/- 1.5, with only three having values of >27.0.”
Let’s just take this point by point.
- “We obtained the heights, weights, and ages, at the time of competition, of all Mr. America winners from 1939 to 1959.” How do they know the information was accurate? I have a copy of the book they cited as a source (The Super Athletes by Willoughby), but the book doesn’t cite a source to verify the numbers. Right off the bat, it’s entirely possible that the reported heights and weights were wrong.
- “Because anabolic steroids were not available in gymnasiums during this era…” Eric Helms has done a great job of documenting the history of steroid creation and dissemination in this article, but in short, it’s not true that steroids weren’t available all the way up to 1959. We can be 99.9% sure that all winners before 1944 were truly drug-free, and quite confident that all winners before 1954 were drug-free (the first corroborated reports of testosterone use in US bodybuilding circles comes from the early 50s). However, there’s a decent chance that a fair amount of the bodybuilders in the late 50s had dabbled with steroids. This isn’t a major issue, but you’d expect more due diligence in a journal article.
- “…these athletes likely represented the maximum FFMI attainable without drugs.” That’s a HUGE reach. Bodybuilding was a tiny sport in the 1940s and 1950s, so to assume the bodybuilders of that day attained the absolute peak of drug-free human muscularity is absurd. Compare the best athletes from the 40s and 50s to the best athletes in essentially any sport today – almost without exception, the top pros of yesteryear would be middling amateurs today as talent pools have grown. There were even several drug-free lifters in the Kouri study with FFMIs higher than several of the Mr. America winners of this era! I’m not going to argue that Grimek (FFMI of 26.9 in 1942), Stanko (FFMI of 27.3 in 1944), Eiferman (FFMI of 27.7 in 1948) and Delinger (FFMI of 28.0 in 1949) weren’t super jacked. However, it’s asinine to assume they represented the absolute peak of drug-free muscularity. In fact, we don’t even know that they were at their all-time best when they won the Mr. America. After the organizers feared that Grimek was unbeatable in 1942, they instituted a rule saying that you were only allowed to win the contest once – all four of these men may very well have gotten more muscular after winning the contest, but they weren’t allowed to compete again.
- “The second author (H.G.P.) estimated the body fat of each athlete from contemporaneous photographs in bodybuilding magazines of the era, averaging the estimates from several photographs of each athlete.” This is where I nearly spat out my coffee. Visually estimating body fat percentages? Based on images from bodybuilding magazines that very well may have been edited? Is this a journal article or a bodybuilding.com thread?
You’d be totally entitled to disregard this section of the study entirely, as it doesn’t live up to literally any reasonable scientific standards. However, I think we can take one thing away from it – unless the cited heights and weights were way off, and unless the body fat estimations were way off, this section kills the notion that an FFMI of 25 is a hard limit.
To use Stanko as an example (FFMI of 27.3 in an era where we can be 99.99% sure he was truly drug-free) – he was 2.3 FFMI points over the “natty limit” of 25. Stanko was apparently 5’11.5” (1.816m) and weighted 223lbs (101.15kg). An FFMI of 27.3 means he had 199.2lbs (90.37kg) of lean body mass, putting his estimated body fat percentage at 10.67%.
To have an FFMI of only 25, he could have at most 182.49lbs (82.78kg) of lean body mass, putting his body fat percentage at 18.16%. In other words, either his reported weight was way off, one of the authors estimated he was a pretty lean 10% body fat when he was actually closer to 20%, or his FFMI was considerably higher than 25 in an era where we can be almost 100% certain he was truly drug-free.
Let’s move on to the discussion:
“These findings must be regarded as preliminary and subject to several possible methodological limitations.”
Good starting point.
First limitation: some users may have slipped into the nonuser group. “However, athletes were recruited under circumstances for which they had no particular motivation to lie about steroid use nor anything to gain from doing so. Furthermore, all 74 nonusers produced urine samples negative for all steroids. Finally, even if an occasional self-described nonuser had in fact used steroids, this phenomenon would not affect our estimates of a maximum FFMI in the region of 25 because many nonusers clustered just below 25, and it is impossible that all of the individuals in this cluster were lying.” Fair, and reasonable.
Second limitation: “Our sample size of 74 nonusers might not have been large enough to exhibit fully the upper limits of muscularity naturally attainable.” You don’t say.
They go on to explain that the data from Mr. America winners were supposed to help mitigate this limitation. The average FFMI of the Mr. America winners from 1939 to 1959 was 25.4. Of the 20, 13 had FFMIs above 25, 8 had FFMIs above 26, and 3 had FFMIs above 27, with a peak of 28.0. And again, it’s ludicrous to assume that one of a handful of bodybuilders before bodybuilding was even a major sport just happened to reach the absolute peak of drug-free human muscularity. I’m sure there are errors in this data set, but those errors would need to be systematic, correlated, and huge to not completely destroy the notion that it’s impossible for any drug-free lifters to achieve an FFMI above 25.
Third limitation: “our calculations of body fat are based on skinfold measurements taken by a single investigator, and our calculations for the Mr. America winners are based on body fat estimates from blinded examination of several photographs of the individual. These methods are certainly prone to a degree of error.”
That’s an understatement.
“However, calculations from skinfold measurements, using the above equation, display a standard error of 3.4% of body fat and thus are sufficiently accurate for our purposes. For example, a 1.8-m, 90kg (71-inch, 198-pound) athlete, measured at 10% body fat would have a normalized FFMI of 25.0. If this body fat measurement were off my 3%, and true body fat were 13%, the FFMI would still be 24.2, a difference of only 0.8 units.”
Of course, the error could go in the other direction, and that same 3% error could yield an FFMI of 25.8 with an overestimation of body fat percentage. With 9 people in the non-users group having FFMIs between 24.0 and 24.9, it’s very unlikely that at least one didn’t have a normalized FFMI above 25 that was masked by a body fat estimation error.
Fourth limitation: “our formula may not be satisfactory for fat individuals. Because a gain in the fat component of the body is consistently accompanied by some gain in the lean component, it is possible that fat individuals might be able to exceed substantially an FFMI of 25 without steroids.” This is very valid.
What do they mean by “fat?” The nonuser group had an average body fat percentage of 12.5 ± 5.5%, so it should apply to people down to at least 7% body fat, and up to people with at least 18% body fat. I often see people say that the FFMI “limit” only applies to very lean people (i.e. sub-10% body fat), but that’s not something that can be taken away from this study.
Fifth limitation: FFMI may not be a useful screening tool for endurance athletes because endurance athletes can take gear and still be scrawny. Well, yeah. That’s obvious.
Wrapping this sucker up
The idea that an FFMI of 25 is any sort of “natty limit” could only come from a really bad interpretation of one really bad study.
The study itself was not set up to investigate the limits of drug-free human muscularity. Its sample was too small, and its inclusion criteria were way too lax. The raw data themselves don’t support an FFMI “limit” of 25.0 (as one or two subjects out of just 74 had FFMIs above 25) – that came about only after a fairly arbitrary post-hoc “correction.” Furthermore, with the error inherent in estimating body fat percentages via calipers and the cluster of people with FFMIs just below 25 after “correction,” it’s very likely that at least one or two people out of 74 had normalized FFMIs above 25.0 that were masked by body fat misestimations.
Furthermore, the presented FFMIs of Mr. America winners pre-1960 should either destroy any notion that an FFMI of 25 is a “limit,” really shake your confidence in the study as a whole (again – visual body fat estimations? Seriously?), or both.
Finally, the authors themselves say that their findings should be regarded as preliminary, and that an FFMI cutoff of 25 should only be used as an initial screening tool. They don’t propose that everyone with an FFMI over 25 is on steroids. They just think that an FFMI over 25 should be a red flag to warrant actual drug screening.
Make no mistakes – this study is an example of very bad science. It’s so flawed in so many ways that I’m really not sure how it got published.
However, the subsequent interpretations of this study have been even worse. Anyone using this paper to argue that no drug-free lifter can attain an FFMI of 25 without drugs either doesn’t know how to critically appraise and interpret research, they’re purposefully misrepresenting it to make an invalid point, or they’re just parroting the idea from some other source without actually reading the paper in the first place.
It’s baffling to me that the notion of a FFMI “natty limit” of 25.0 ever got started in the first place. If you’re using this paper as a guide, a more accurate interpretation is just that you’re pretty unlikely to find any or many drug-free bros in a random gym with an FFMI over 25. But by no means does it support the notion that an FFMI of 25 is impossible or nearly impossible to achieve with good genetics and years of hard work. If you take the data at face value, they say that not all that many people will pass an FFMI of 25 without steroids, but that people with great genetics can achieve FFMIs of 26-27+.
In fact, I think proposing a “limit” is wrongheaded in the first place, since human traits tend to be normally distributed. That’s why I’ve always addressed this question probabilistically instead of using black-and-white terms. Probability assessment isn’t as exciting as simplistic (and wrong) black-and-white thinking, but it’s the more rigorous and intellectually honest way to approach this question.
So in summation: stop talking about the “natty limit.” Just stop it. Odds are very low someone hit it before the advent of steroids, and now that steroids exist and drug tests are imperfect, we’ll never know for sure what it is (or even if it exists as any sort of hard limit in the first place). As such, the entire concept is a silly construct that’s unproven and likely unprovable, and if it exists in the first place, no one has any earthly idea where it is.
p.s. I know I said in my last article that I’m done talking about steroids for a long time. I stand by that. This article just discusses a specific claim I wanted to address since I see it parroted so often. As such, I’m filing it under “general myth-busting” and “critical appraisal of research.”
p.p.s. There’s a study being published soon that’s going to blow the idea of an FFMI of 25 as the “natty limit” out of the water. This is just an examination of why the idea was almost fractally wrong in the first place. Edit: the study is up now/